TAKING MY OWN BLOOD PRESSURE READINGS AT HOME
So, my G.P. has asked me to take and record my own blood pressure readings at home.
He advised me to take the readings in the morning and evening; to take three sets of readings each time, leaving a gap between them so that I become more settled. He seems quite happy with the way I presented the first set of results in an Excel spreadsheet, recording the average Systolic and Diastolic readings over time, together with an embedded graph so once one graph no longer fits on a screen on my laptop, I start a new version of the same spreadsheet.
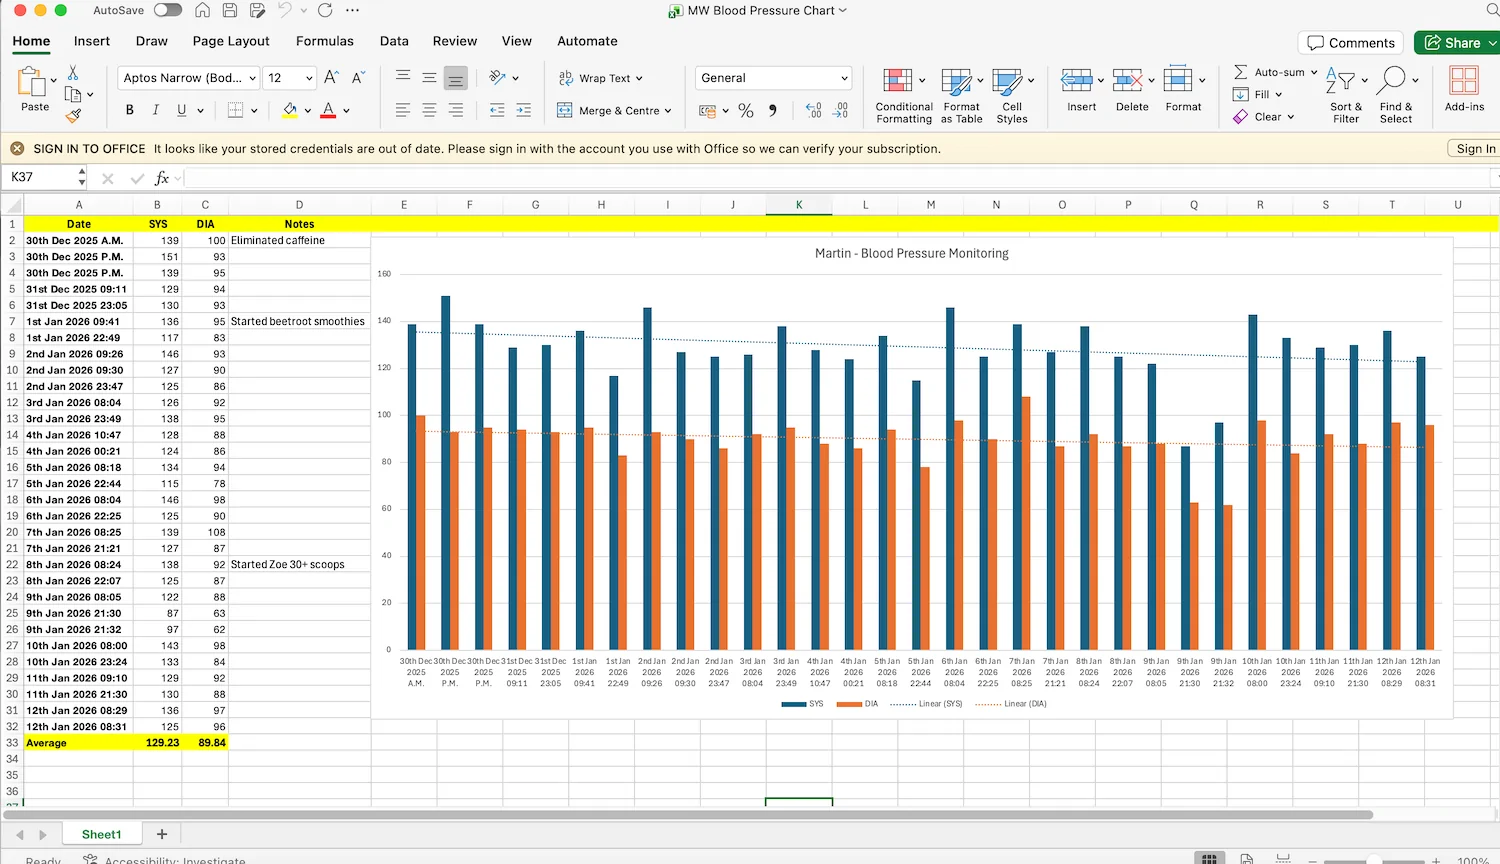
My first set of readings representing the period from 30th December 2025 to 12th January 2026 showing an average Systolic reading of 129.23 and an average Diastolic reading of 89.84.
How I take my readings
This has evolved over time but has become fairly fixed now.
The main things I took from the Adam Story video were:
- Before starting a B.P. reading, I make sure that I have cleared my bladder and my bowels so that I am not in any discomfort from that area of my body.
- I take my morning readings before eating or drinking anything.
- Where possible I sit at my kitchen table so that my arms can be at rest on the table and my feet are flat on the floor.
- Ideally there is not too much activity going on around me. The lights are low, the cats aren't bothering me for food and it is relatively quiet in the room.
- As Adam says in his video, I always use my left arm, it is always bare so I am not measuring through any material and I make sure that it is above the elbow by a margin, not overlapping it. I also ensure that it starts off not too tight, so that I can get two fingers underneath it. I do this by flexing my biceps on my left arm as I am tightening the cuff.
- Adam talks about the mistakes that are made by taking readings with the patient standing with their arm hanging down by their side, when really the cuff needs to be as close to the heart as possible. I realised that I could elevate my arm slightly by resting my elbow on something. Sitting at my kitchen table, I use the box the monitor comes in to elevate my arm a bit higher so it is as near to being level with my heart as possible.
- When I started this process of twice daily readings, I was also trying to manage a long term back problem. As well as doing regular stretches to ease my back I was also taking a morning bath, whenever possible. I noticed that taking my BP readings after my bath, rather than before it had a significant positive (i.e. lowering) effect on my numbers. Hardly surprising, as the effect of soaking in a warm bath is obviously going to help dilate my blood vessels in a positive way. Currently my back is much improved and I no longer feel the need to have a soak in a warm bath each morning. My readings do not appear to have suffered much from this change (I currently shower each day now and usually after I've taken my morning readings). I always make it my first task of the day to take my readings in the morning. At the other end of the day I make it my last task of the day before going to bed.
- Box Breathing. During March my wife suggested I should have a look at some meditation sessions on an app called Insight Timer and I came upon one that is called 'box breathing'. I have been using this during my BP readings ever since. In essence I take two very deep breaths, fully in then fully out and then I start inhaling for a count of 4, holding my breath for a count of 4, exhaling for a count of 4 and then holding my breath for a count of 4. I repeat this pattern a few times before pressing the button on the monitor and continue to breathe using this pattren whilst the cuff tightens and then slackens. I find the woman's voice is quite calming and I started by using the Insight Timer app to talk me through all three readings but now I don't really need the app anymore, I can just do it. Whilst the reading is being taken by the monitor I also close my eyes and imagine myself in my happy place. I believe that this change in the way I take my readings has had a very significant positive effect on the results.